
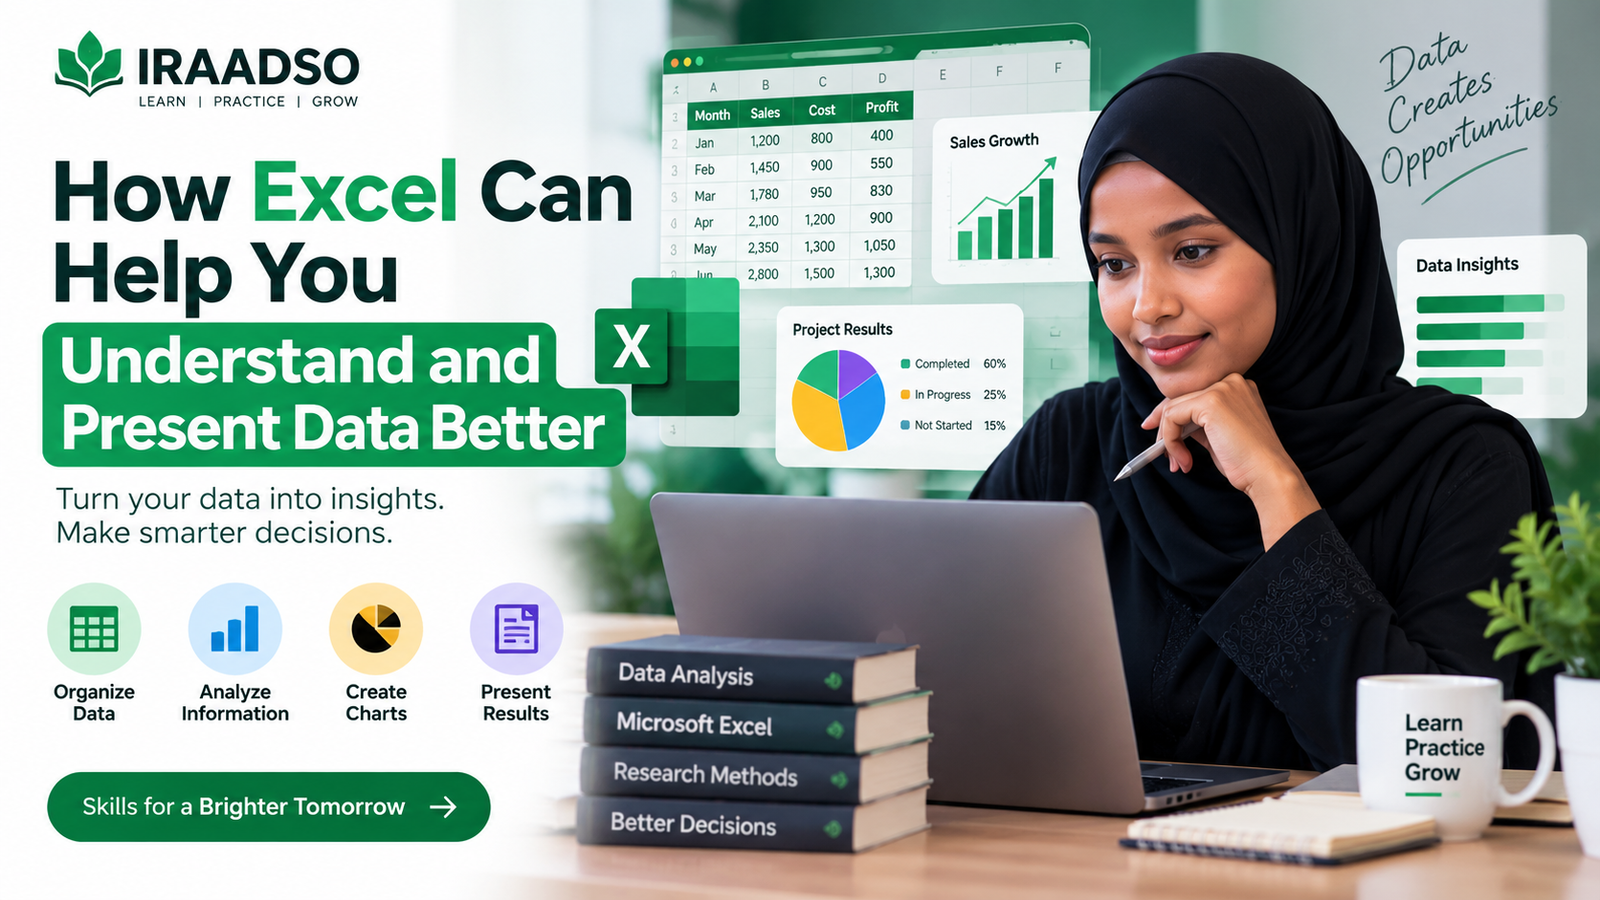

Microsoft Excel is one of the most useful tools for working with data. It can help students, researchers, business owners, and professionals organize information, understand patterns, and present results clearly.
You do not need to be a data expert to start using Excel. With a few basic skills, you can turn a large amount of information into something much easier to understand.
Organize Your Data
Excel allows you to arrange information in rows and columns.
For example, you can use Excel to organize:
- Student results
- Business sales
- Survey responses
- Monthly expenses
- Customer information
- Research data
When your data is organized properly, it becomes easier to read, search, and analyze.
Make Calculations Faster
Instead of calculating everything manually, Excel can do the work for you.
You can use formulas to calculate totals, averages, percentages, and many other values.
For example, if you have monthly sales data, Excel can quickly show you:
- Total sales
- Average sales
- Highest-performing month
- Lowest-performing month
This saves time and reduces mistakes.
Find Patterns in Your Data
Excel can help you understand what your data is telling you.
Using tools such as sorting, filtering, and PivotTables, you can compare information and identify important patterns.
For example, a business owner may discover which product sells the most, while a researcher may identify common responses from survey participants.
Create Charts and Visualizations
One of the best features of Excel is the ability to turn data into charts and graphs.
You can create:
- Bar charts
- Line charts
- Pie charts
- Column charts
- Dashboards
Visualizing your data makes it easier for other people to understand your findings.
A good chart can sometimes explain information faster than a long report.
Build Simple Dashboards
Excel can also be used to create dashboards that summarize important information in one place.
A dashboard may include charts, totals, percentages, and key performance indicators.
This is useful for managers, businesses, researchers, and organizations that need to monitor their data regularly.
Present Your Findings Clearly
Understanding data is important, but presenting it clearly is equally important.
Excel helps you transform raw data into professional tables, charts, and reports that can be shared with others.
This can improve presentations, research reports, business reports, and decision-making.
Final Thoughts
Excel is more than a spreadsheet tool. It is a practical skill that can help you organize information, analyze data, identify patterns, and communicate your findings clearly.
Whether you are a student, researcher, entrepreneur, or professional, learning Excel can make working with data much easier.
At IRAADSO, learners can develop practical skills in Excel, data analysis, visualization, and reporting to help them make better decisions using data.
Hi, this is a comment.
To get started with moderating, editing, and deleting comments, please visit the Comments screen in the dashboard.
Commenter avatars come from Gravatar.